What is non-HDL cholesterol?
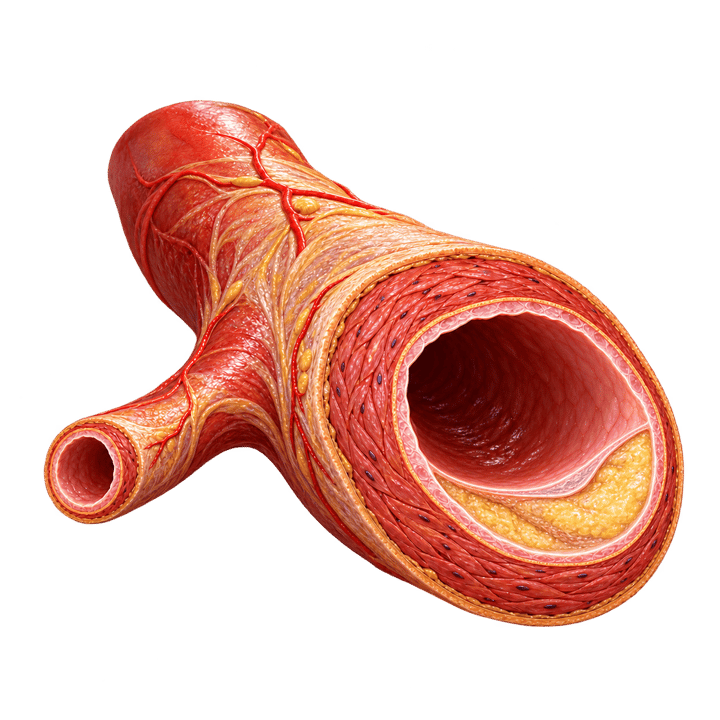
It’s your total cholesterol minus your HDL. That leaves the cholesterol in every particle that can clog an artery, LDL and the triglyceride carriers alike. Its 2026 goals sit 30 points above LDL’s, at under 130, 100 or 85 mg/dL by your risk.
What we’d do
Work it out every time you get a panel, since it takes ten seconds and many reports leave it off. If your triglycerides are 150 or more, trust your non-HDL over your LDL. It comes from two numbers the lab measures, it barely moves after a meal, and the guideline calls it a better predictor of heart disease than LDL.
How to work it out
Take the total and subtract the HDL. A total of 240 with an HDL of 60 gives a non-HDL of 180 (4.7 mmol/L). Against the goal of under 130 at borderline or intermediate risk, that’s 50 over.
| Your 10-year risk | Non-HDL goal | LDL goal |
|---|---|---|
| Low, under 3% | no number goal | no number goal |
| Borderline or intermediate | under 130 (3.4) | under 100 (2.6) |
| High, 10% or more | under 100 (2.6) | under 70 (1.8) |
| Heart disease at very high risk | under 85 (2.2) | under 55 (1.4) |
A non-HDL that stays at 190 to 219 is on the guideline’s list of things that raise risk.
Why it catches what LDL misses
LDL counts the cholesterol in one kind of particle. Non-HDL counts it in all the kinds that can get into an artery wall, including the triglyceride-rich ones your liver sends out and Lp(a). It’s like counting every car heading into the city instead of only the sedans.
When triglycerides are low, the two numbers tell the same story. When they’re high, more cholesterol rides in the triglyceride carriers, and the LDL on most reports gets harder to trust, since it’s calculated with a guess about those carriers. In 1.35 million US panels, the old formula labs use was right about an LDL under 70 only 40% of the time when triglycerides were 200 to 399. Non-HDL needs no formula. The guideline says it’s “particularly useful” when triglycerides are 150 or more.
The meal test
In 33,391 Danish adults, researchers compared panels taken at different times after people’s last meal. LDL dipped by up to 8 points after eating and triglycerides rose by up to 26. Non-HDL didn’t change at all. That makes it the steadiest number on a panel you didn’t fast for.
Non-HDL and the ratios
The total to HDL ratio uses the same two numbers, but the 2026 guideline sets no goal for any ratio. Non-HDL has goals. What is my cholesterol ratio? shows both, and What is my non-HDL cholesterol? holds yours against its goal. If your triglycerides are high or you have diabetes, the next step past non-HDL is ApoB.
4 sources
- Blumenthal RS, Morris PB, Gaudino M and others, 2026 ACC/AHA guideline on the management of dyslipidemia, JACC, 2026doi.org
- The same guideline, full text, Circulation, 2026api.iscpcardio.org
- Langsted A, Freiberg JJ and Nordestgaard BG, Fasting and nonfasting lipid levels: influence of normal food intake on lipids, lipoproteins, apolipoproteins, and cardiovascular risk prediction, Circulation, 2008pubmed.ncbi.nlm.nih.gov
- Martin SS and others, Comparison of a novel method vs the Friedewald equation for estimating low-density lipoprotein cholesterol levels from the standard lipid profile, JAMA, 2013pubmed.ncbi.nlm.nih.gov