Your LDL over the years
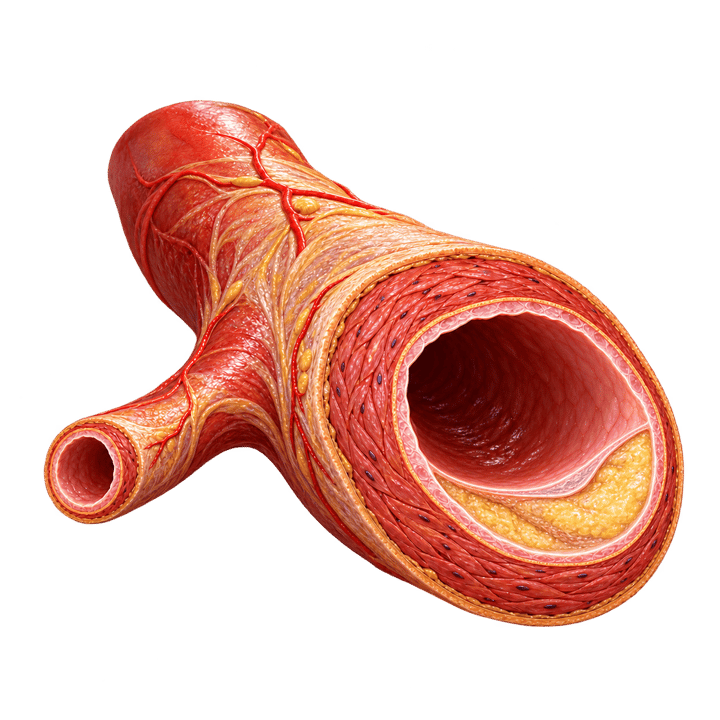
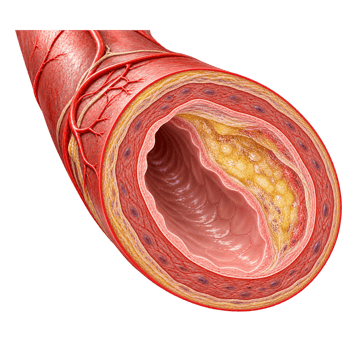
Plaque builds from LDL times years. Put in your number, try one change from an age you pick, and see when your running total reaches the burden linked to heart disease.
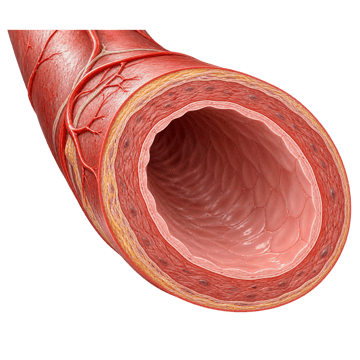
At 130 mg/dL, you reach the line at 48. With the portfolio diet from 35 (LDL about 93), at 53, about 5 years later.
By age 75, the change takes about 15% off your lifetime LDL total.
A teaching model, not your risk. It holds today's LDL all the way back to birth, which overcounts your younger years, and treats smoking and blood pressure as simple multipliers. The line is where the European Atherosclerosis Society draws enough LDL burden for heart disease to develop, which a typical person without an inherited LDL problem reaches at about 55.
What your result means
- The age on the line is a teaching number. It shows how level and time add up, using averages from studies. It isn't when you'll have a heart attack, and nobody's arteries follow a line exactly.
- Earlier changes move the age most. Slide the starting age later and watch how much less the same change buys. That's lower for longer, in one picture.
- Food changes are sized from their trials. About 11 points for the fat swap and 13 for psyllium, one at a time, since they overlap and never add up.
- Smoking and blood pressure count too. They damage the artery wall, so the same LDL does more harm. The model treats them as simple multipliers, which is rougher than real biology.
- Already past the line? It isn't a cliff. Lowering LDL from here still slows the build-up, and talk to your doctor about where you stand.
How it works
The chart adds up your LDL year by year, in mg/dL times years. It holds today's number back to birth, which overcounts the young years, since LDL climbs an average of 1 to 2 mg/dL a year in young adulthood. From the age you pick, it uses the LDL after one change, at that change's trial average: the fat swap (69 feeding trials), psyllium (28 trials), oats (58 trials), weight loss (about 8 points in 6 to 12 month trials) or the portfolio diet (28.6% in a month). A moderate statin takes off 30 to 49% (the model uses the middle) and a high-intensity one 50% or more.
The dashed line is the LDL burden the European Atherosclerosis Society drew in its 2013 guidance on familial hypercholesterolemia: about 160 mmol-years, enough for heart disease to develop. A typical person without FH gets there around 55, and someone with untreated FH by about 35. The society's 2017 consensus found the effect of LDL grows with how long you're exposed to it.
Smoking and high blood pressure weight each year from today by their odds ratios for a first heart attack in INTERHEART, a study in 52 countries: about 2.87 for smoking and 1.91 for high blood pressure. Real risk depends on far more than this, which is why the page never gives a percentage.
10 sources
- Nordestgaard BG, Chapman MJ, Humphries SE and others, Familial hypercholesterolaemia is underdiagnosed and undertreated in the general population: guidance for clinicians to prevent coronary heart disease (European Atherosclerosis Society), European Heart Journal, 2013, Figure 8pmc.ncbi.nlm.nih.gov
- Ference BA, Ginsberg HN, Graham I, Ray KK and others, Low-density lipoproteins cause atherosclerotic cardiovascular disease, European Atherosclerosis Society consensus statement, European Heart Journal, 2017pubmed.ncbi.nlm.nih.gov
- Yusuf S and others, Effect of potentially modifiable risk factors associated with myocardial infarction in 52 countries (INTERHEART), Lancet, 2004pubmed.ncbi.nlm.nih.gov
- Jovanovski E and others, Effect of psyllium fiber on LDL cholesterol, American Journal of Clinical Nutrition, 2018pubmed.ncbi.nlm.nih.gov
- Mensink RP, Effects of saturated fatty acids on serum lipids and lipoproteins, World Health Organization, 2016, as tabulated by Food Standards Australia New Zealandfoodstandards.gov.au
- Ho HV and others, The effect of oat beta-glucan on LDL-cholesterol, British Journal of Nutrition, 2016pubmed.ncbi.nlm.nih.gov
- Zomer E and others, Interventions that cause weight loss and the impact on cardiovascular risk factors, Obesity Reviews, 2016pubmed.ncbi.nlm.nih.gov
- Jenkins DJ and others, Effects of a dietary portfolio of cholesterol-lowering foods vs lovastatin, JAMA, 2003pubmed.ncbi.nlm.nih.gov
- Nicholls SJ and others, Effect of evolocumab on progression of coronary disease in statin-treated patients (GLAGOV), JAMA, 2016pubmed.ncbi.nlm.nih.gov
- Blumenthal RS, Morris PB, Gaudino M and others, 2026 ACC/AHA guideline on the management of dyslipidemia, JACC, 2026doi.org